Upload a Navisworks HTML (Tabular) report and get interactive charts, filters, and grouping — then export to PDF, Excel, or HTML. Nothing to install.
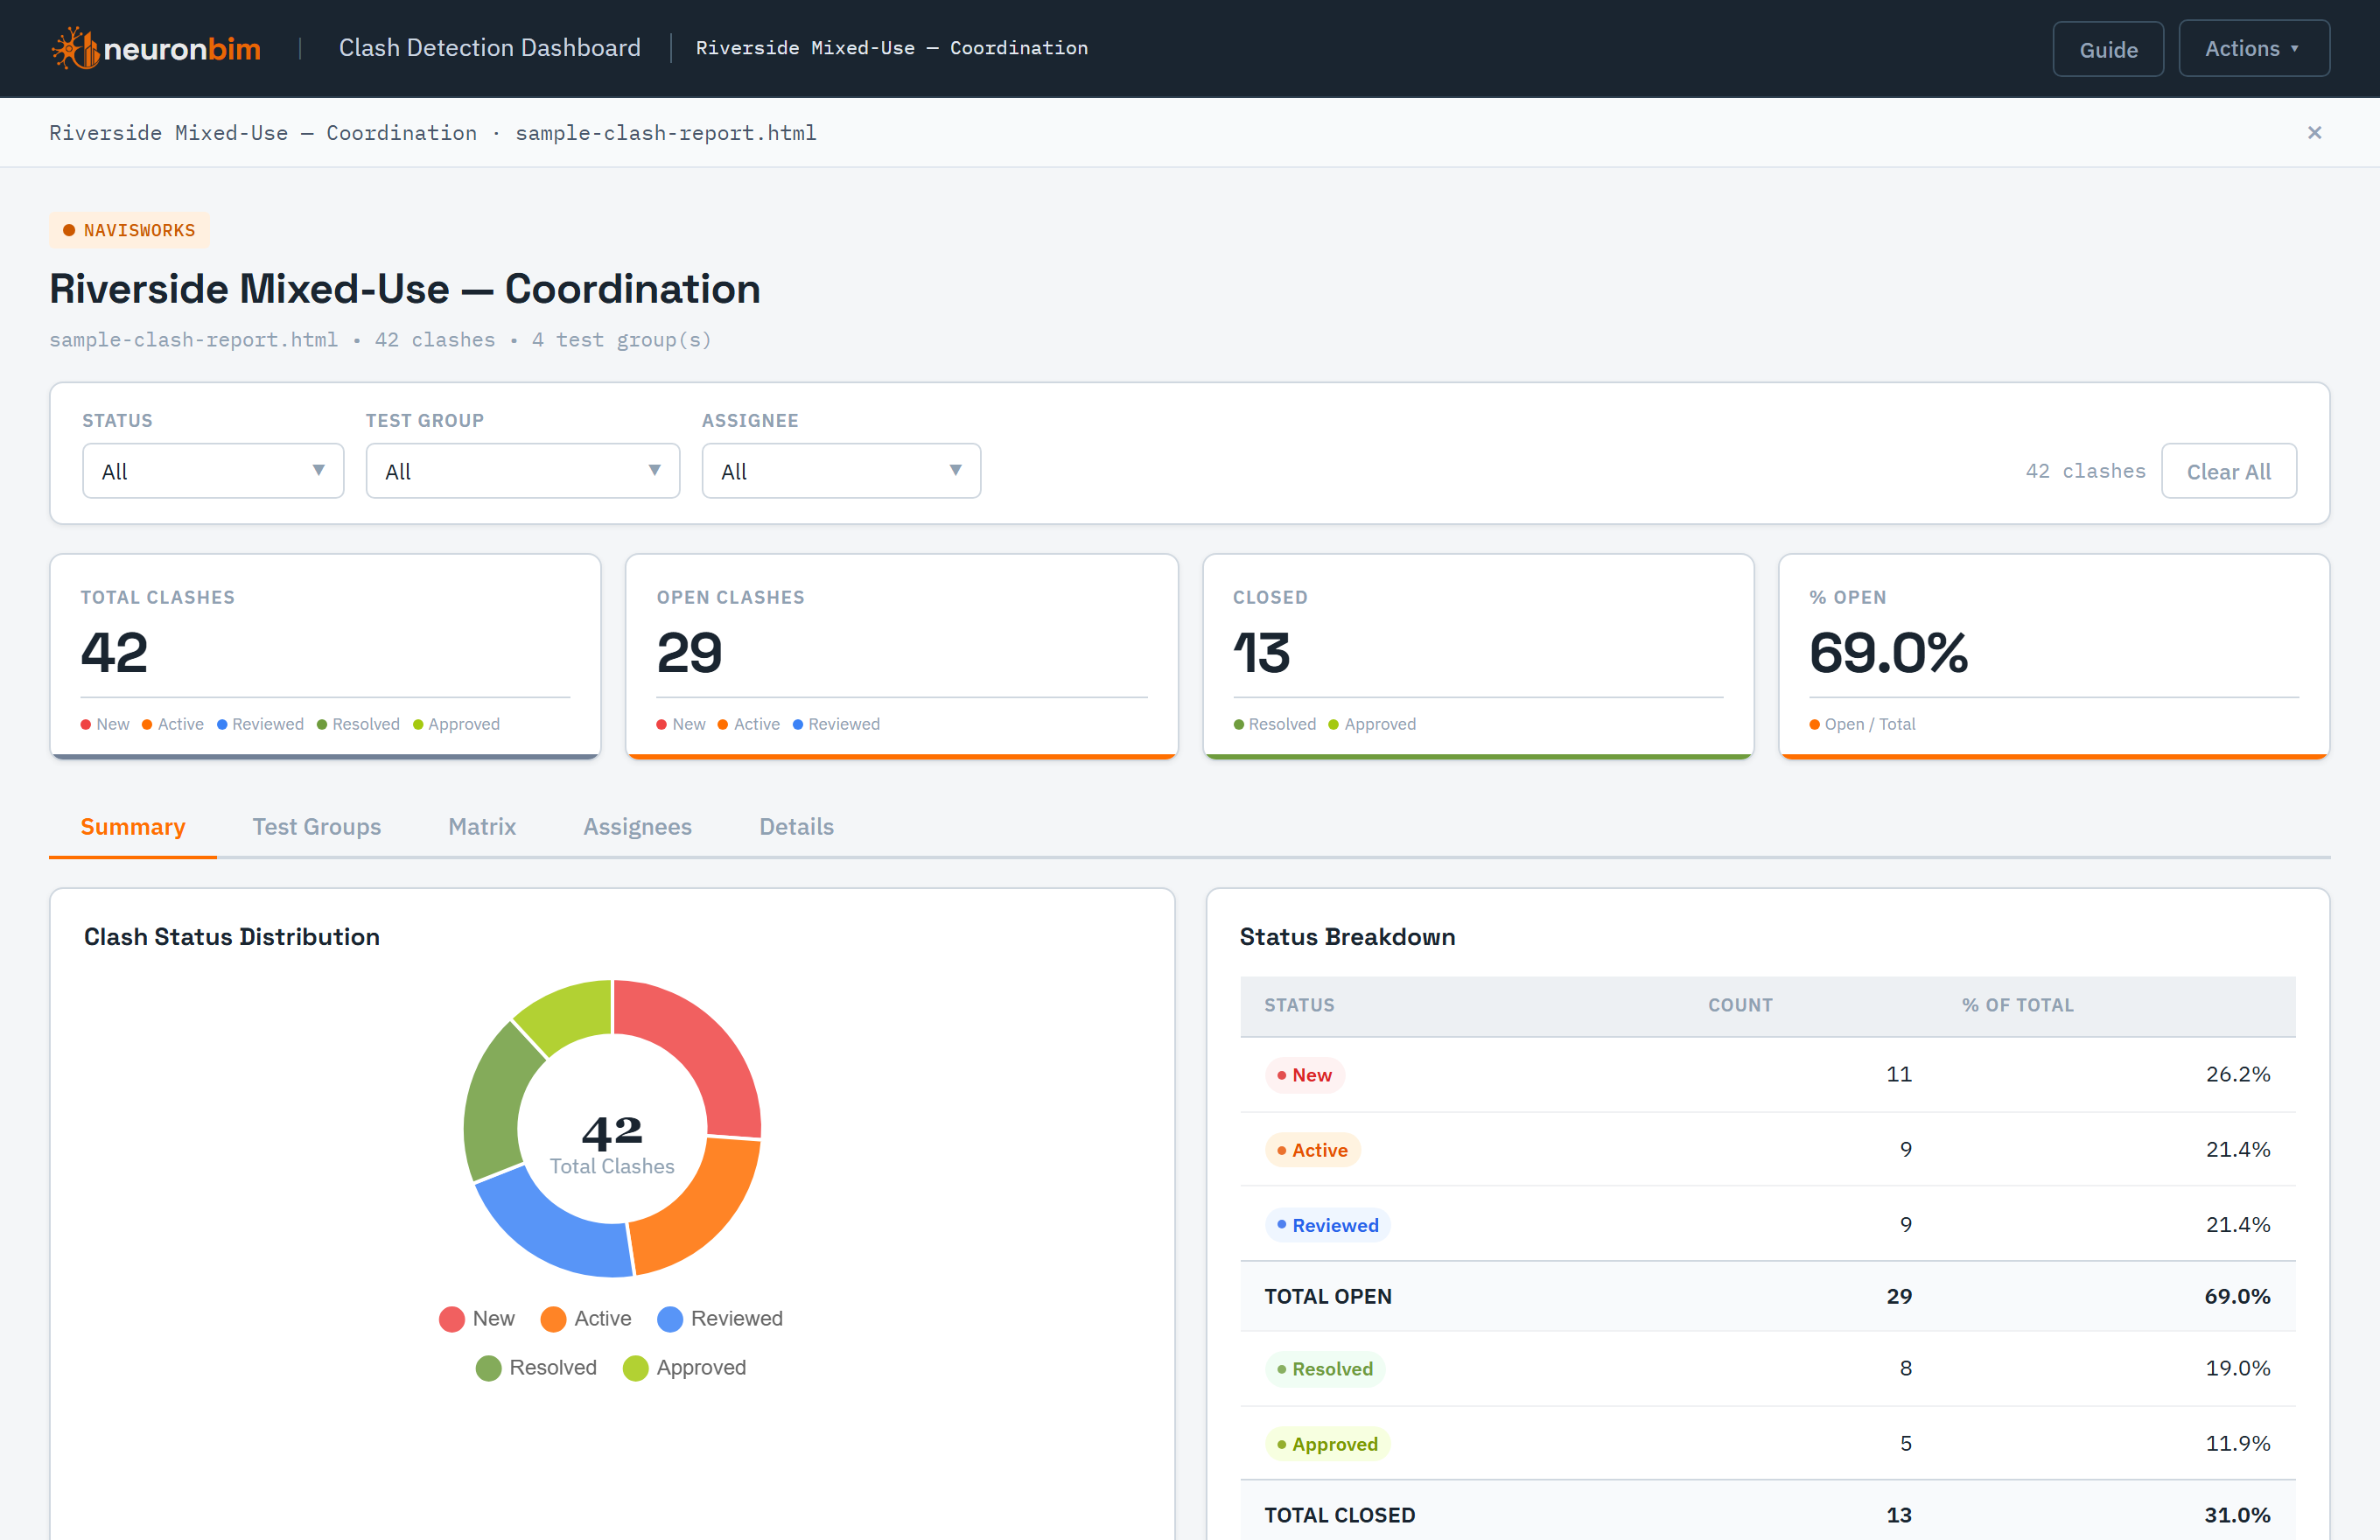
Raw Navisworks clash reports are hard to read and harder to share. The Clash / Issue Report Dashboard parses your exported report and renders it as an interactive dashboard the whole team can actually use.
Everything runs in your browser — your report never leaves your machine unless you choose to save a snapshot. Sign in to save a report and reopen it later.
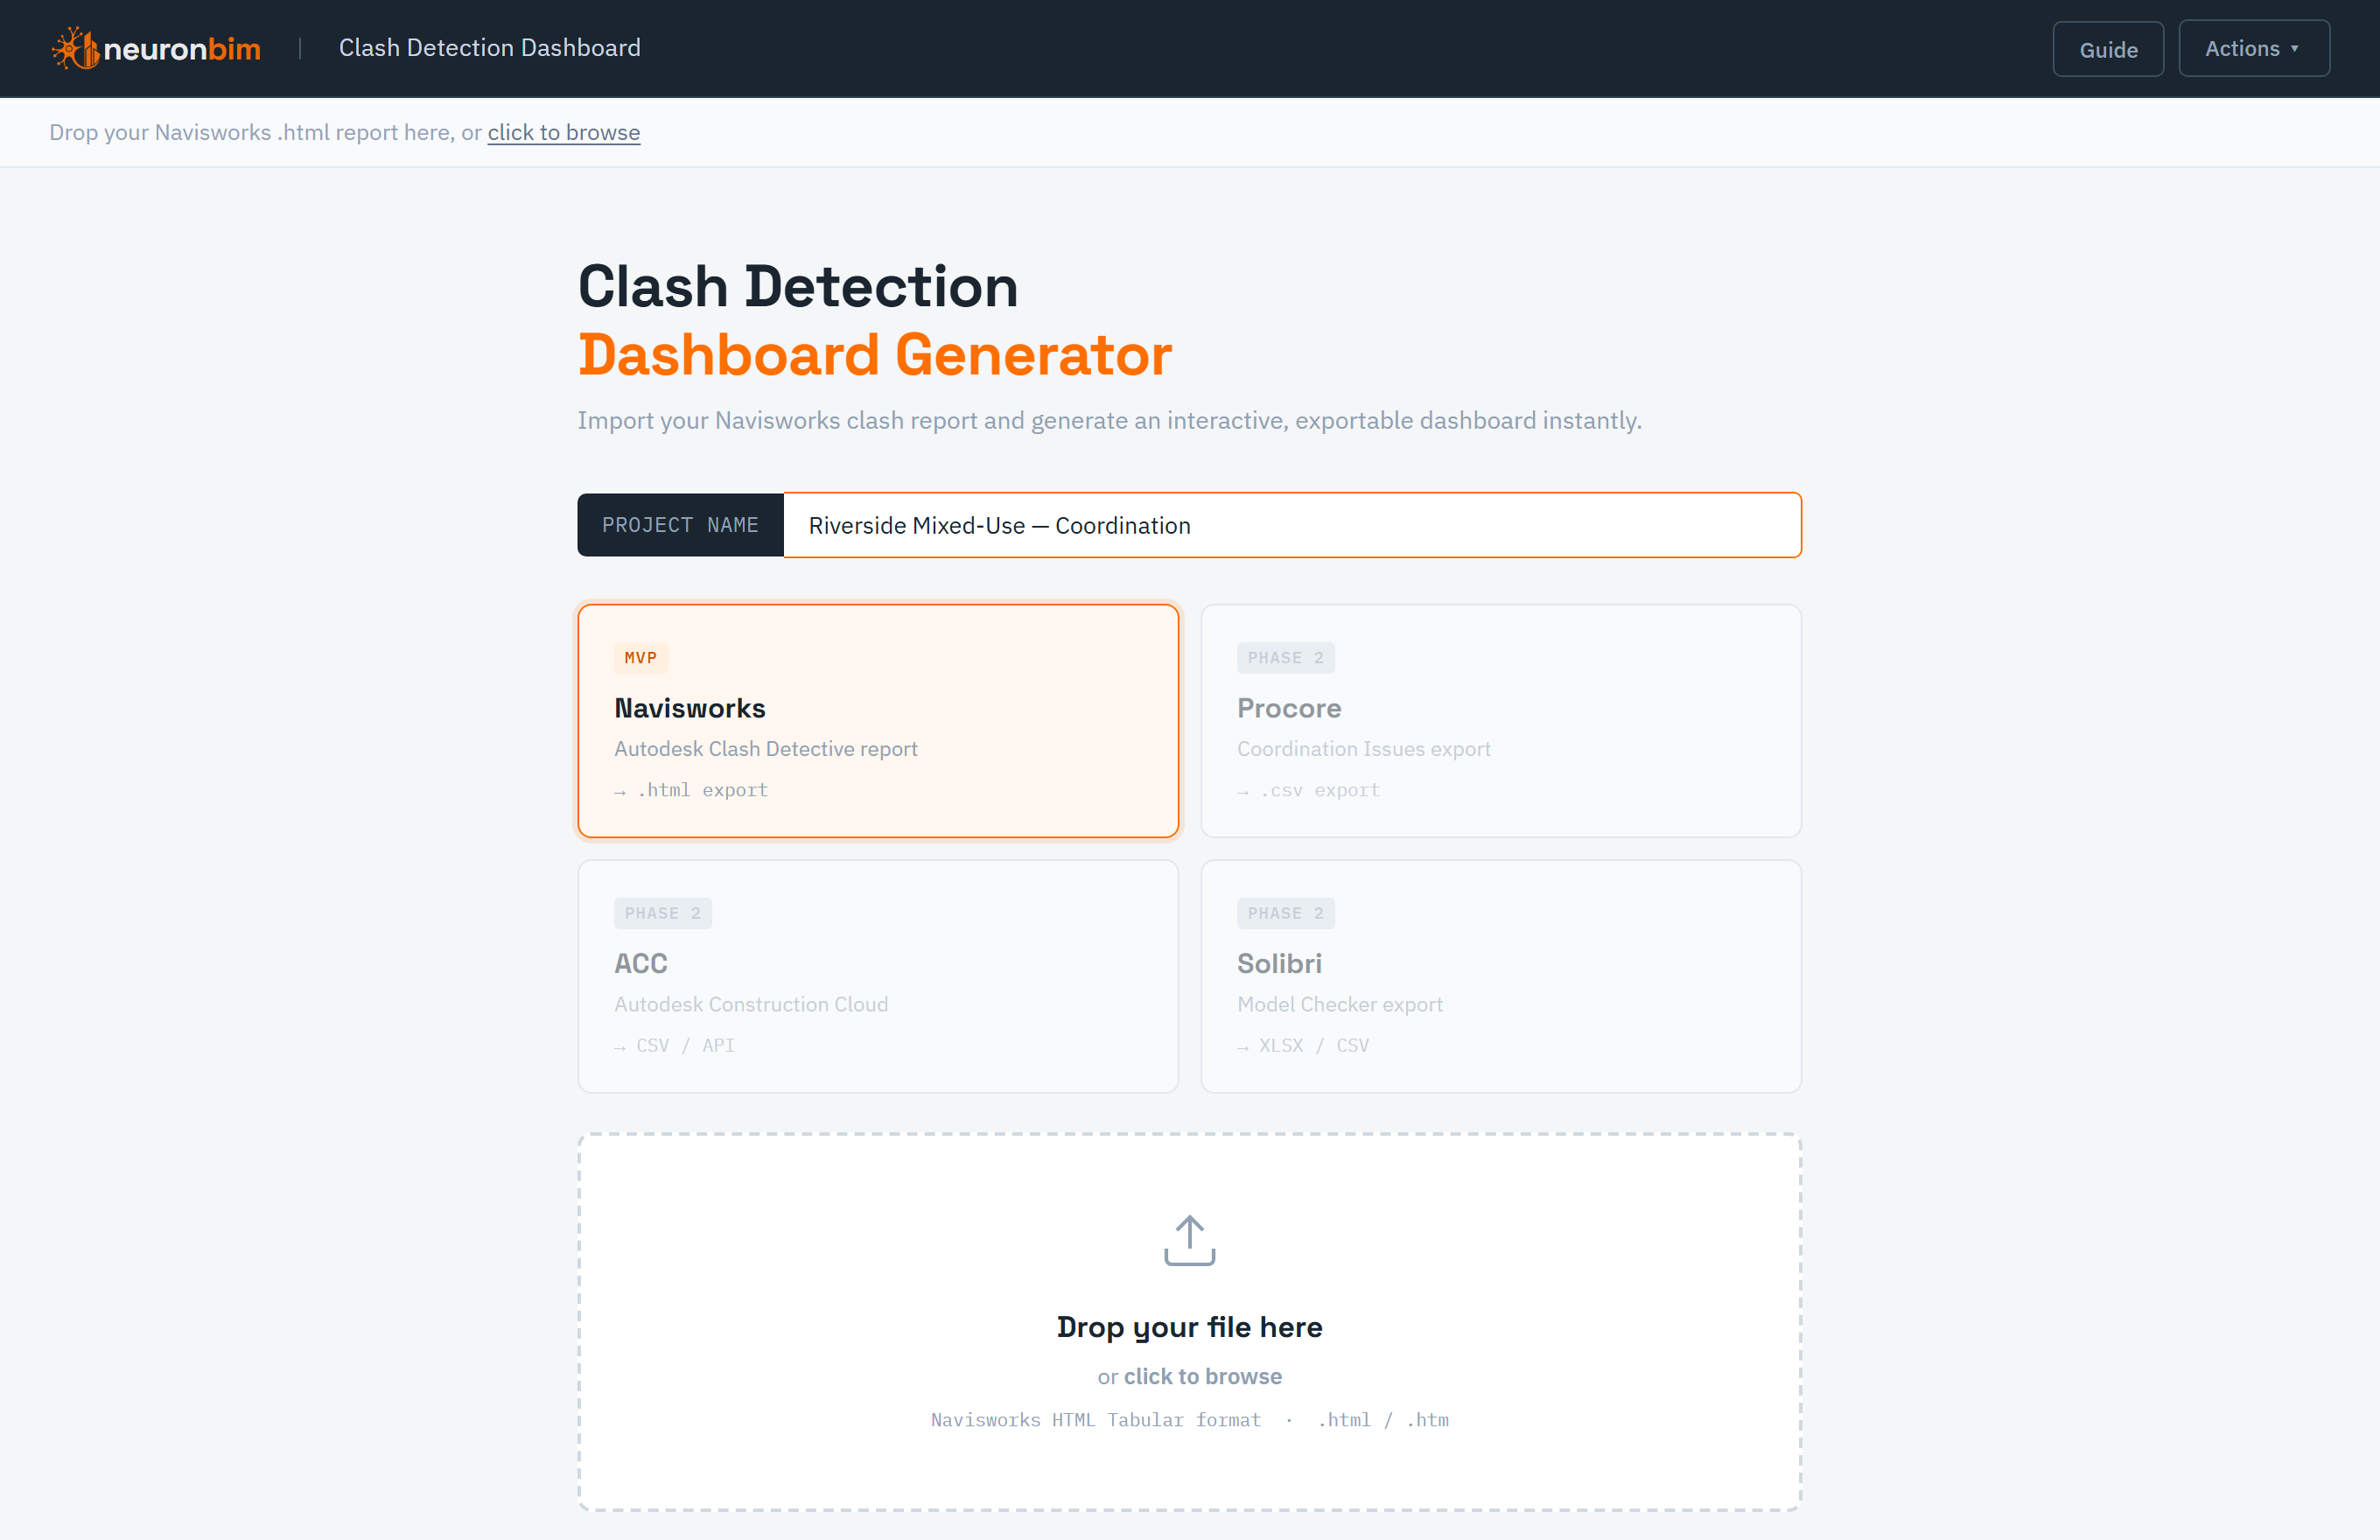
In Navisworks Manage, open Clash Detective → Write Report and set the format to HTML (Tabular). Drop the exported .html file onto the dashboard — it's parsed instantly, right in your browser.
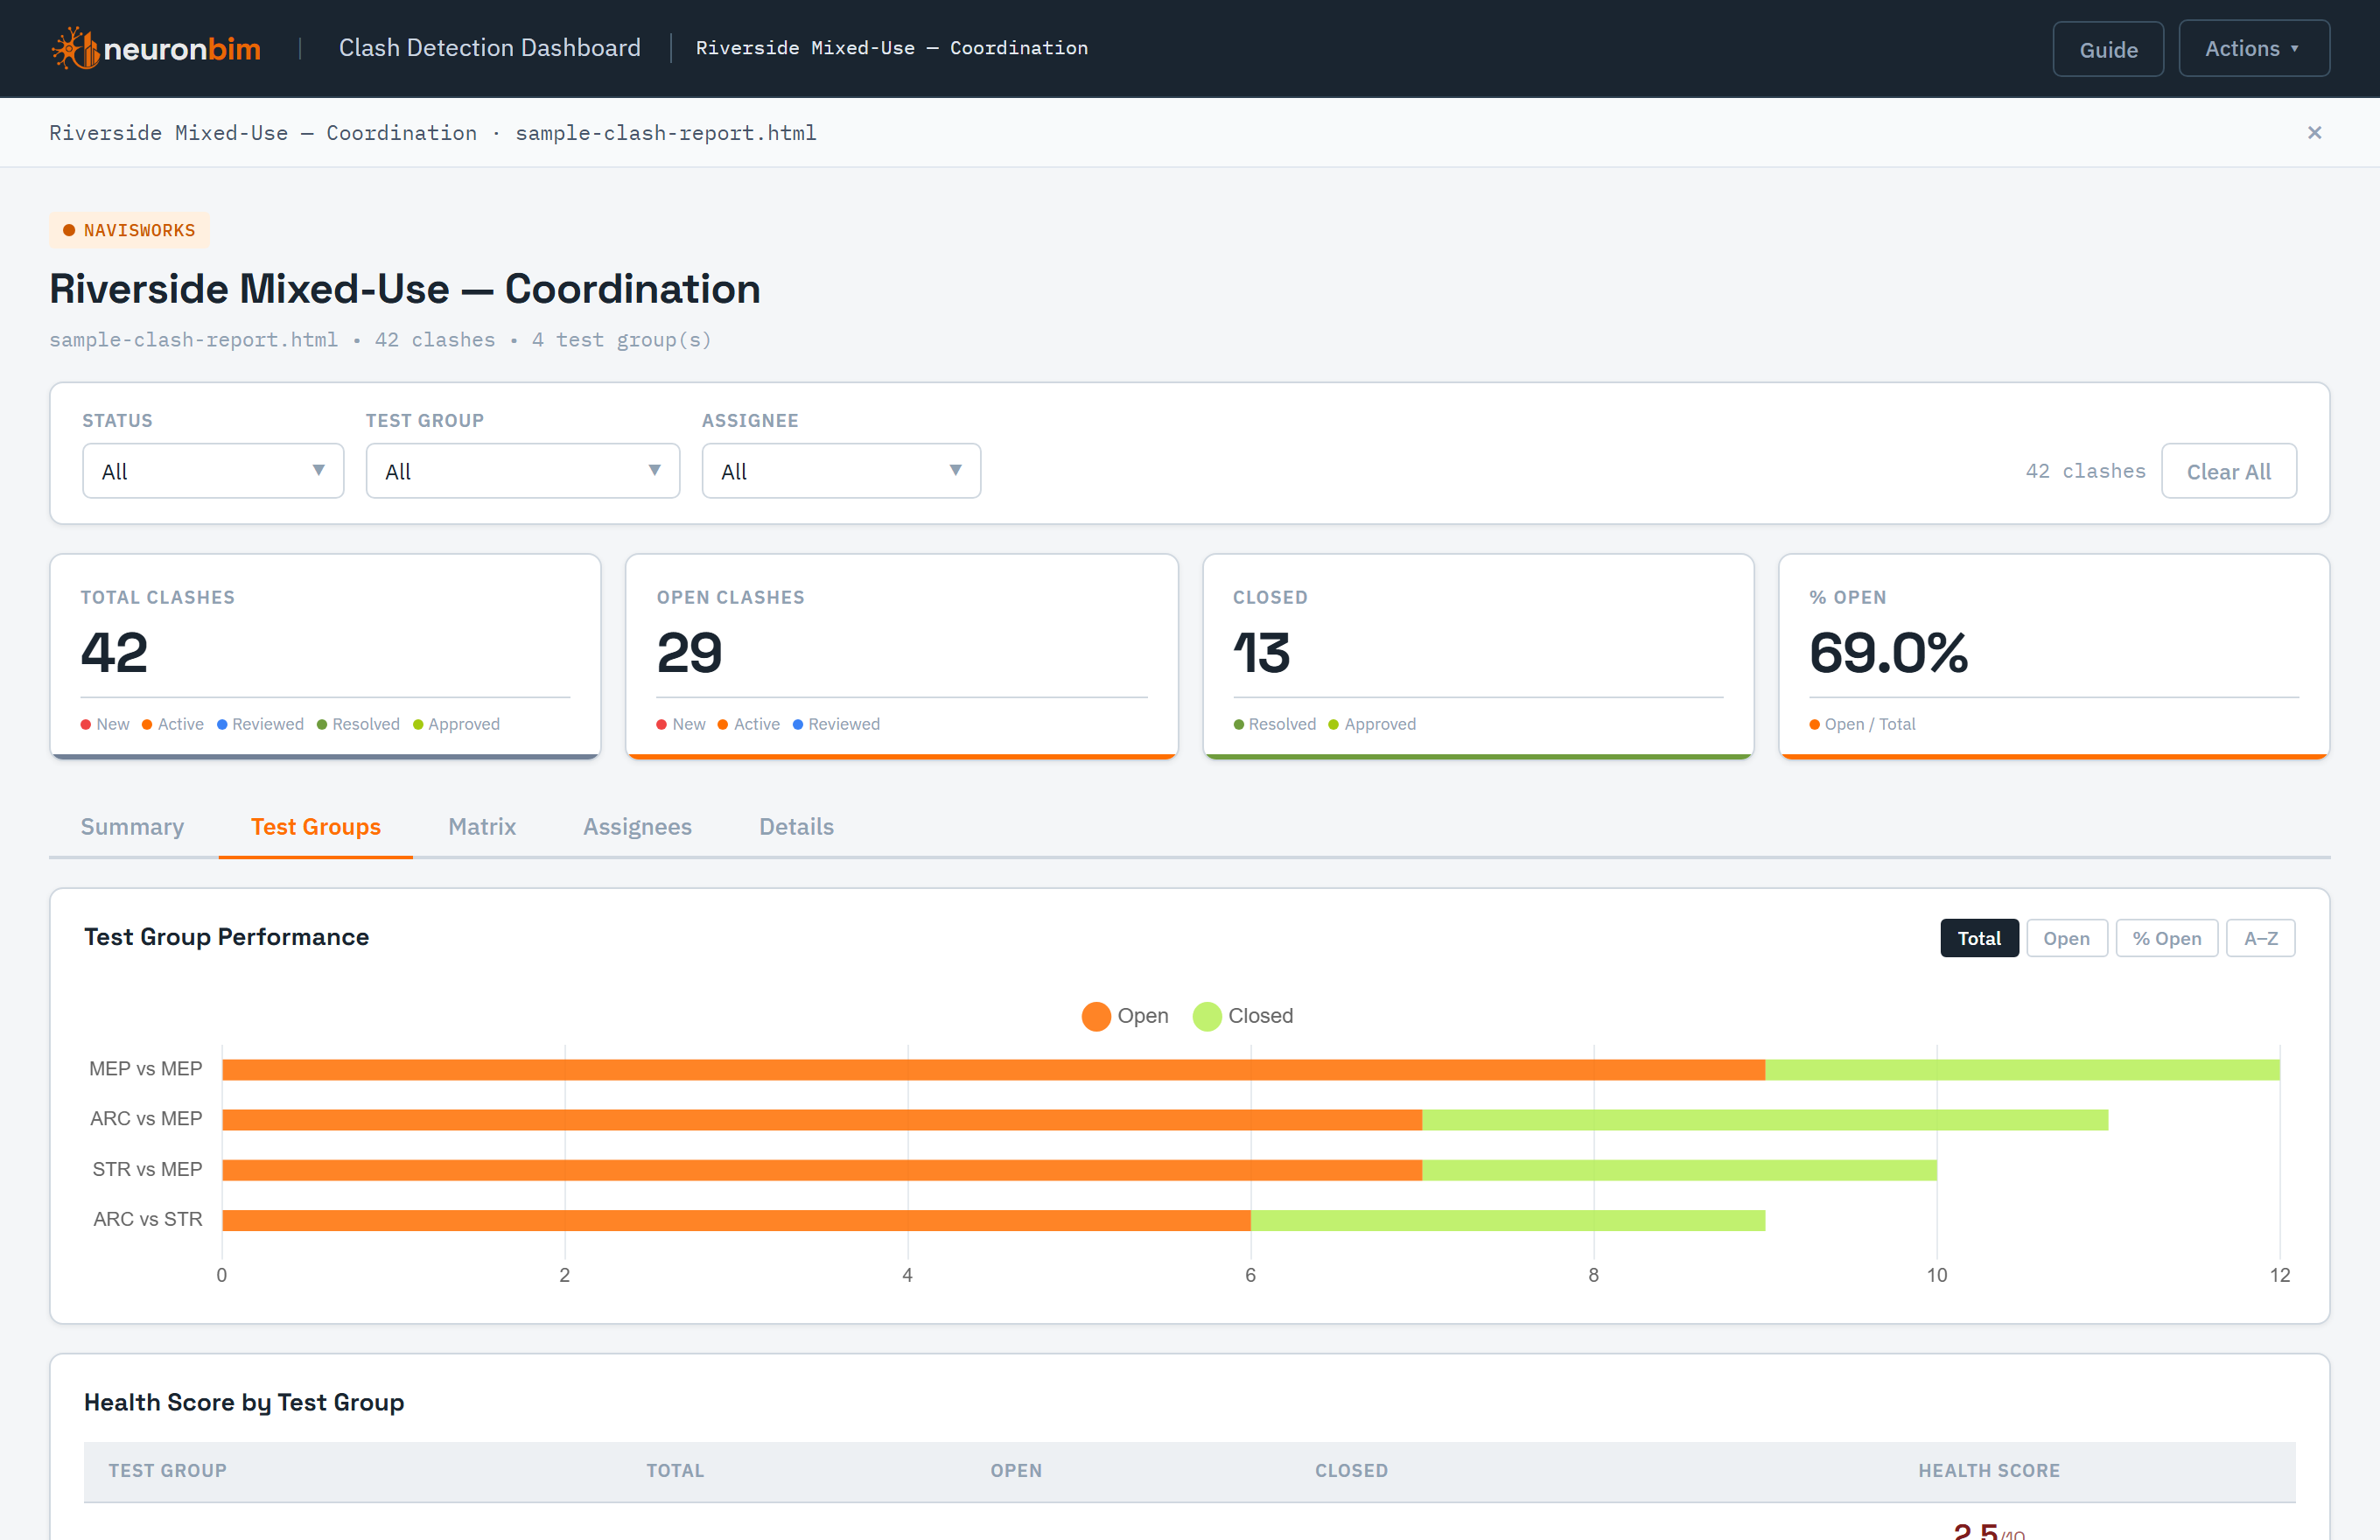
See clash counts broken down by test, status, and group in interactive charts, then filter and group the clash table to focus on exactly what matters for this coordination round.
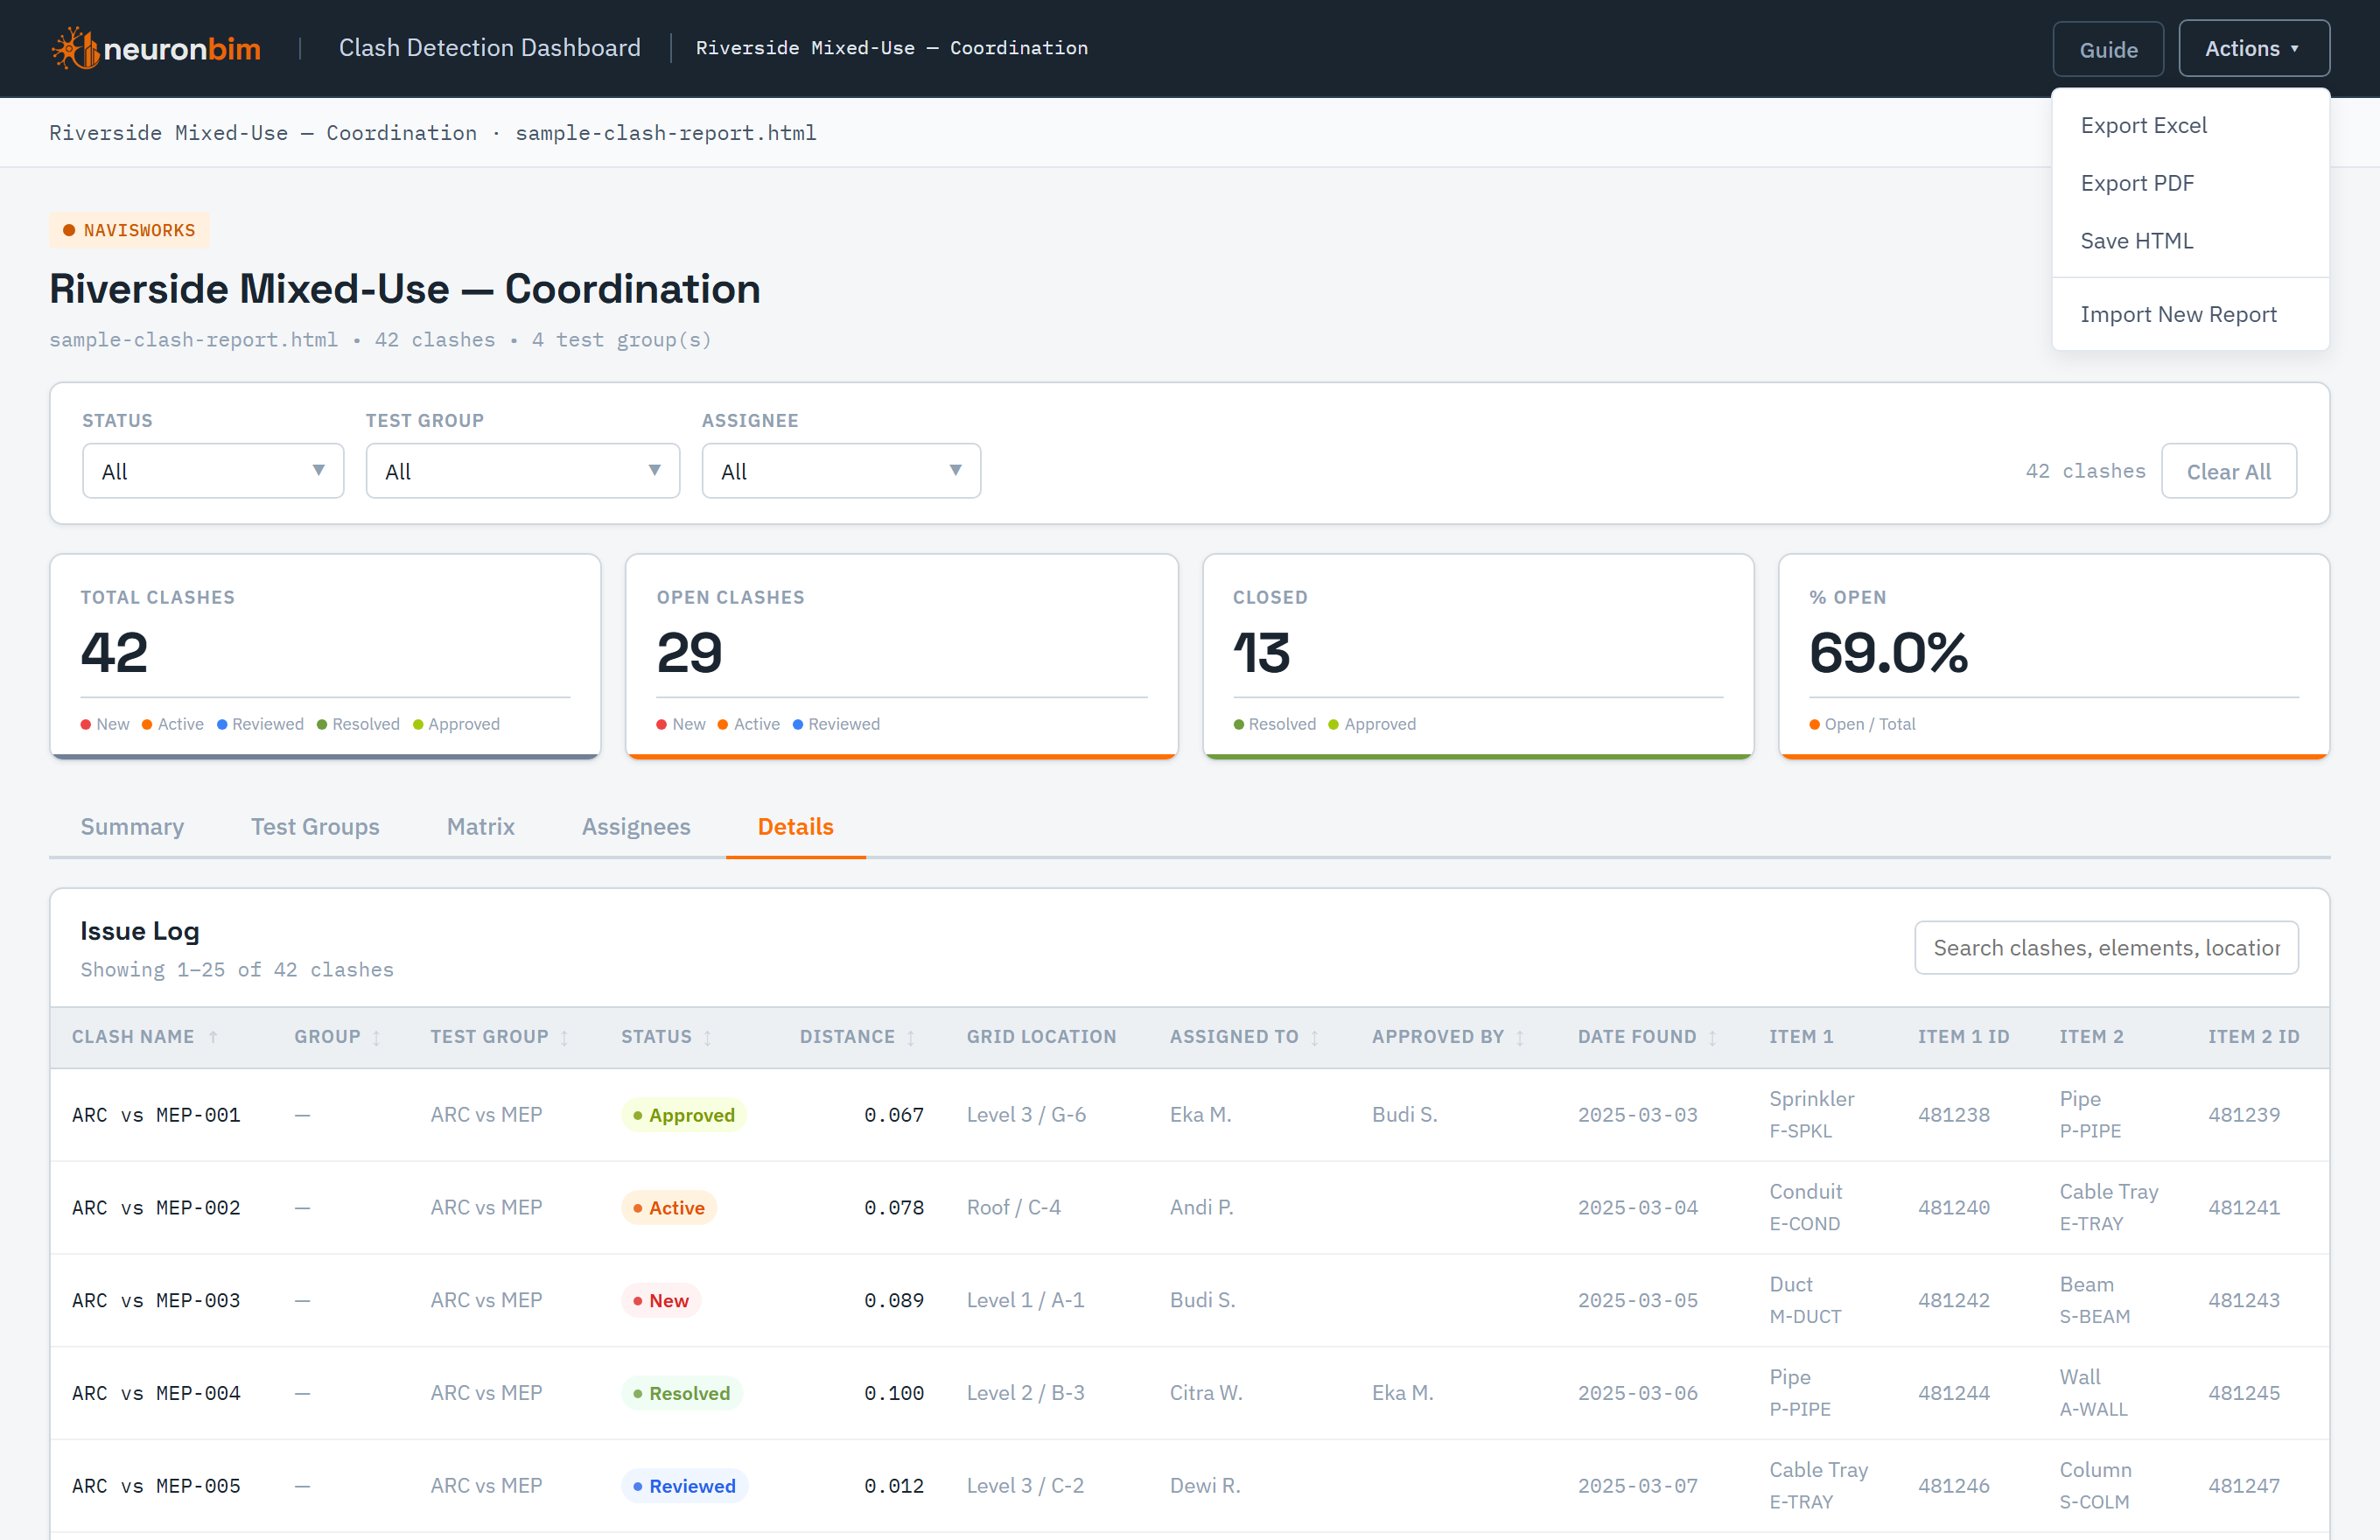
Export a polished report to PDF, Excel, or standalone HTML to circulate — or, when signed in, save the snapshot to your account and reopen it whenever you need it.
Navisworks HTML (Tabular) export — drop in the .html file and go.
Clash counts by test, status, and group at a glance.
Slice the clash table to focus a single coordination round.
Every clash in a clean, sortable table beneath the charts.
PDF, Excel, and standalone HTML in a couple of clicks.
Signed-in users can save a snapshot and return to it later.
Got a clash report?
Upload it and get a shareable dashboard in seconds — free, in your browser. Sign in to save and reopen your reports.
Open the dashboard →